
OpenSAFELY Talking Therapies logo

Author: Milan Wiedemann

  • From public NHS Talking Therapies reports to research insights: Introducing the nhstt R package

    From public NHS Talking Therapies reports to research insights: Introducing the nhstt R package

    In our previous post we introduced the NHS TT data reports that NHS England publishes openly alongside interactive dashboards for exploring key measures directly in a browser. These datasets cover various measures, including referral activity, waiting times, clinical outcomes, and patient-reported outcome measures. The value of this publicly available data has been demonstrated by Clark et al. (2018), who used the annual publicly available NHS TT reports to study between-service variation in clinical outcomes. They found that organisational factors including waiting times, missed appointments, and the proportion of patients receiving a course of treatment were associated with rates of reliable recovery and improvement. This illustrates the broader role of public reporting in supporting transparency, benchmarking, and research on variation in routine psychological therapy services (Clark et al. 2018Clark 2018). The monthly data, which is less commonly used for research than the annual reports, complements the annual publications by providing more timely signals for monitoring service activity and identifying measures or periods that warrant closer investigation.

    The nhstt R package is built on top of these publicly available datasets and designed to complement the existing tools and dashboards. It provides an additional point of access to the same data in a tidy, analysis-ready format across all available reporting periods. In this post we use treatment end codes from the monthly activity and performance data as a worked example, but the same approach applies to any of the monthly measures in the datasets. The examples are descriptive and intended to illustrate what can be done with the data, not to draw conclusions about individual services.

    Treatment end codes

    When a referral ends in the reporting period, NHS TT services record a reason using a standardised treatment end code. These codes group referral outcomes into three categories: (1) referred but not seen, (2) seen but not taken on for a course of treatment, and (3) seen and taken on for a course of treatment. In line with national reporting, a patient is deemed to have had a course of treatment in NHS Talking Therapies if they have had at least two clinical sessions (coded as ‘assessment and treatment’ and/or ‘treatment’) before discharge (National Collaborating Centre for Mental Health 2024). This post focuses on the end codes for referrals where patients were seen and taken on for a course of treatment, and captures the recorded reason their treatment ended.

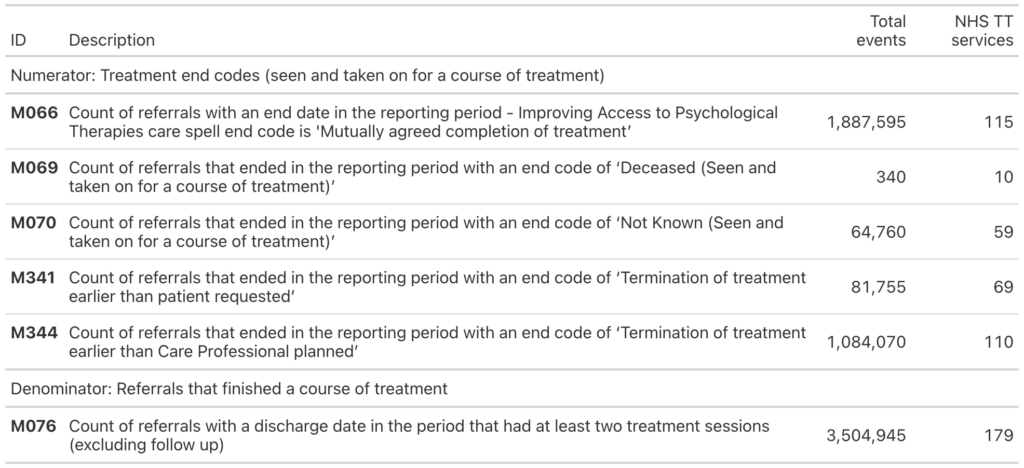
    The monthly dataset includes counts for each end code, available from January 2021 to March 2026. Table 1 shows the five end codes for referrals seen and taken on for a course of treatment, together with M076, which counts the total number of referrals that finished a course of treatment and serves as the denominator when calculating proportions. Total recorded events and the number of services contributing data are shown for each measure. The four most commonly recorded end codes are used in the figures below; the Deceased end code (M069) is recorded in too few referrals to visualise. All monthly measures implemented in the nhstt R package can be explored online.

    Table 1: End codes for referrals seen and taken on for a course of treatment in the monthly NHS TT dataset (January 2021 to March 2026), with total recorded events and number of services contributing data. M076 is the denominator measure used to calculate proportions.
    Monthly trends and variation in treatment end codes

    Across 63 reporting periods, these monthly data make it possible to look beyond annual totals and examine whether patterns in treatment end codes are stable or change over time. Because services differ considerably in size, we present both raw counts and proportions relative to M076 (total referrals finishing a course of treatment). We first show service-level trends across all services, then use decile bands to place two example services in context.

    Before presenting the results, we made two pragmatic data quality decisions for this post. First, we excluded 382 individual data points where the calculated proportion exceeded 100%, as these are not plausible and likely reflect recording or data quality issues. Second, we excluded 64 services with a median monthly M076 count below 20, or where any end code proportion was at or above 99% in at least one reporting period, as these patterns may be difficult to interpret reliably and require closer examination. These decisions were made to demonstrate how one might decide to work with this data and are not intended as a recommended analytical approach. In a research context, decisions about which services and data points to include or exclude should be guided by the specific research question. Where patterns in the monthly data appear unusual, cross-checking summed monthly values against the corresponding published annual report for the same period can help identify whether discrepancies reflect genuine recording differences or administrative timing effects such as delayed data entry.

    Trends across all services

    Figure 1 shows the monthly count of referrals recorded against each of the four end codes for referrals seen and taken on for a course of treatment, across all NHS TT services. Each line represents one service. The counts show variation in the absolute volume of referrals recorded against each end code across services and over time.
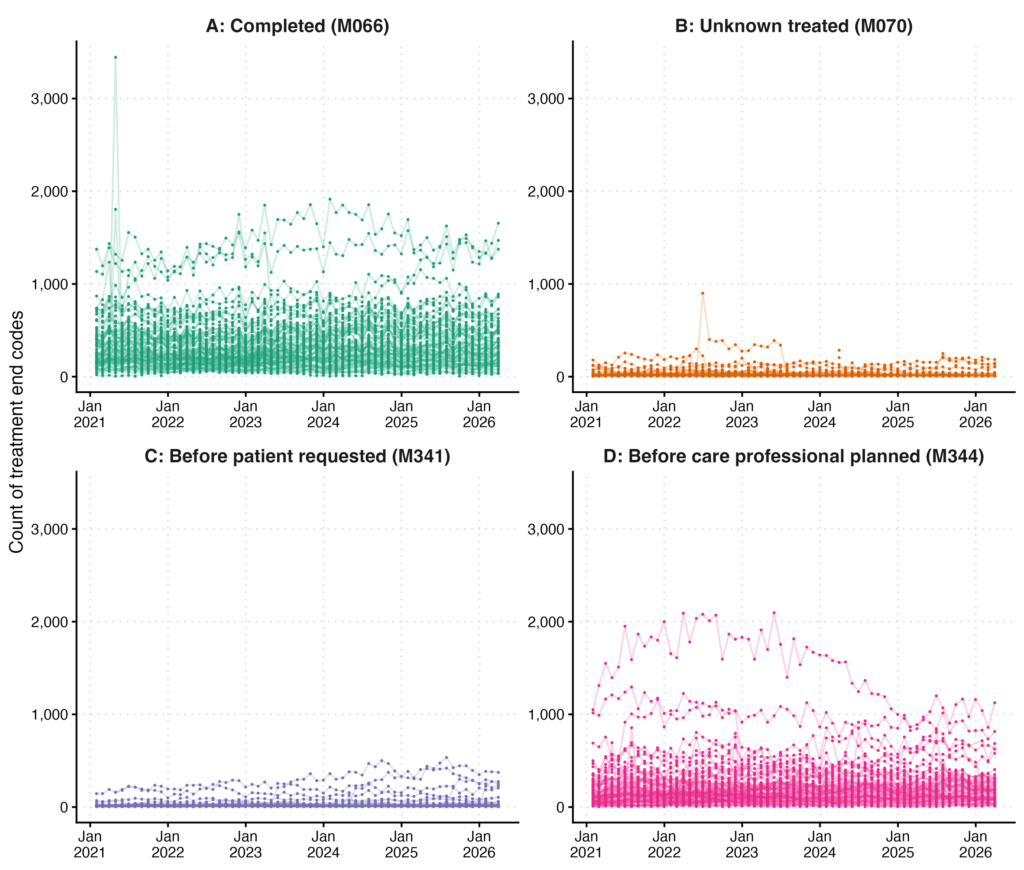
    Figure 1: Monthly trends of individual NHS TT services in counts of treatment end codes for referrals seen and taken on for a course of treatment, for the four most commonly recorded end codes.

    Figure 2 shows the same four end codes expressed as proportions of finished-course referrals (M076). Once service size is accounted for, most services fall within a broadly similar range for each end code and follow consistent trends across the reporting period. A small number of services stand out as consistent outliers in their proportions, particularly for Completed (M066; mutually agreed completion of treatment), Before care professional planned (M344), and Unknown treated (M070).
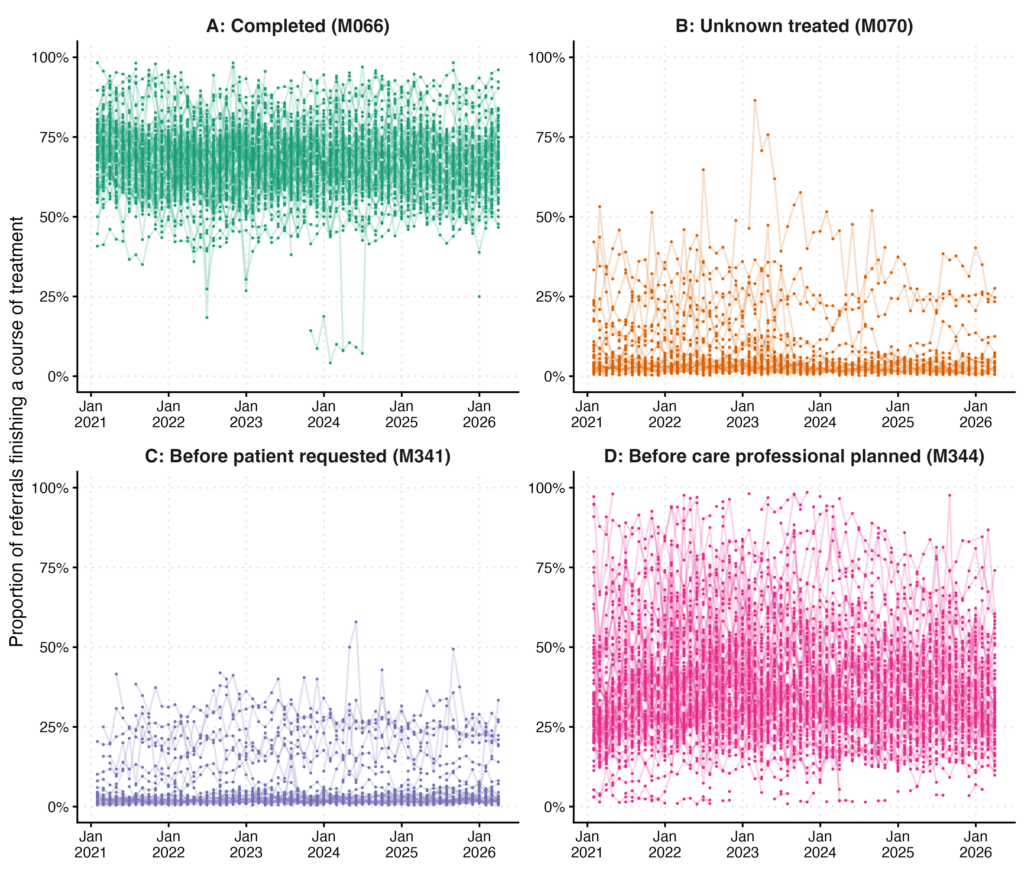
    Figure 2: Monthly trends of individual NHS TT services in the proportion of finished-course referrals (M076) assigned each treatment end code for referrals seen and taken on for a course of treatment, for the four most commonly recorded end codes.

    Comparing services with decile bands

    Figure 3 uses decile bands to place the two example services in the context of the full distribution across all NHS TT services, expressed as proportions of finished-course referrals. Read more on why we think decile charts are a useful tool to communicate variation in a previous blog we wrote. The shaded bands show the distribution from the 10th to the 90th percentile in decile steps, with darker shading closer to the median. A service outside the bands falls in the top or bottom 10% for that month. The width of the bands reflects how much variation there is between services, with wider bands indicating greater spread. These charts summarise activity patterns and are not intended as rankings of service quality.
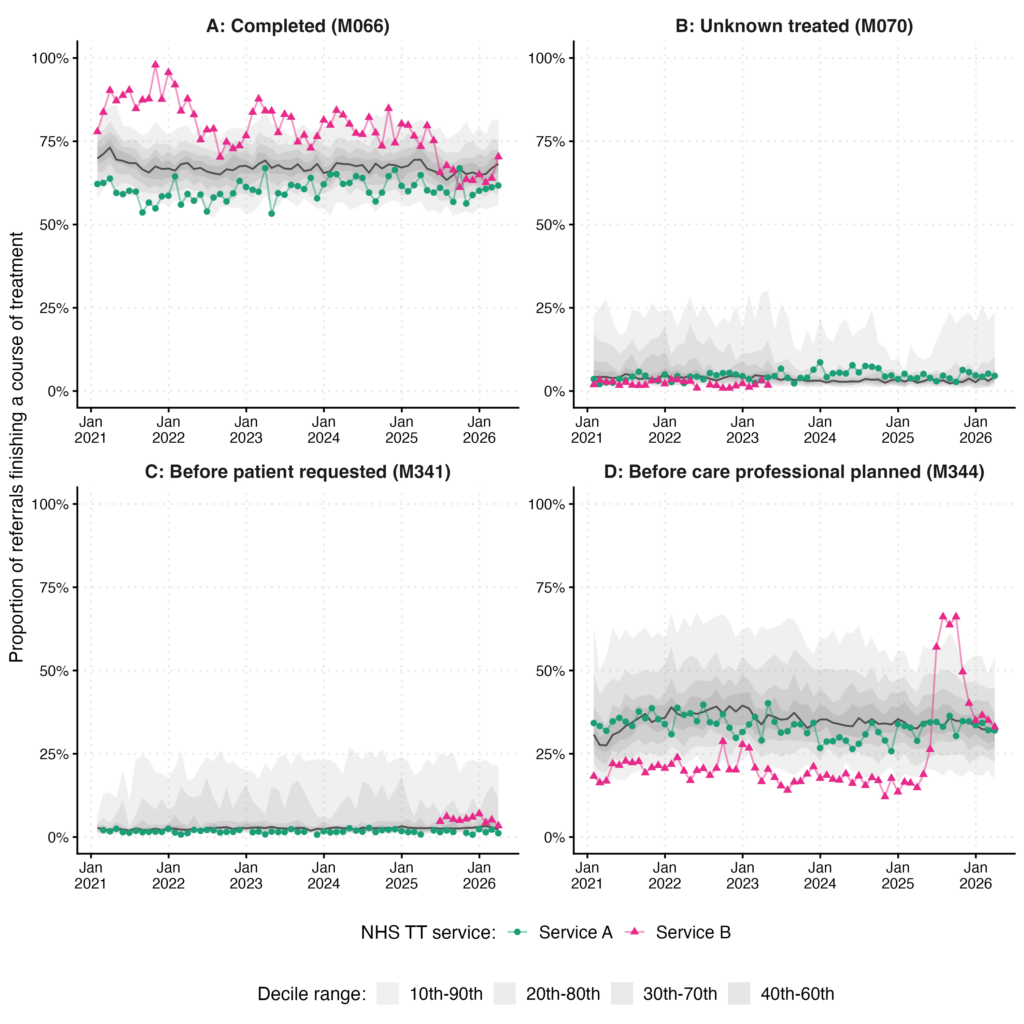
    Figure 3: Decile charts showing overall variation and two example services for treatment end codes among referrals seen and taken on for a course of treatment, expressed as proportions of finished-course referrals (M076), for the four most commonly recorded end codes. Shaded bands show the 10th to 90th percentile range in decile steps. The dark line shows the median.

    Each panel shows the proportion of finished-course referrals assigned one of the four treatment end codes. For the Completed end code (panel A), which records mutually agreed completion of treatment rather than all referrals finishing a course of treatment, Service A tracks below the median throughout, while Service B sits well above the median from 2021 onwards, at times in the top 10% of services, before falling to around the median from mid-2025. For the Unknown treated end code (panel B), Service A sits close to the median throughout. Service B only contributes data until early 2023, sitting slightly below the median while reporting. For the Before patient requested end code (panel C), Service A remains just below the median throughout. Service B only contributes data from mid-2025, sitting slightly above the median. For the Before care professional planned end code (panel D), Service A tracks close to the median throughout. Service B sits well below the median for most of the period, often in the bottom 10% of services, before a sharp rise peaking around 30 percentage points above the median between July and September 2025, after which it returns to around the median by the end of 2025.

    Try it yourself

    The nhstt package makes it easier to access publicly available NHS TT data, is free to use, and is updated regularly as NHS England publishes new reports. It provides access to each dataset in a tidy, analysis-ready format, with no need to find or clean the underlying files. Whether you are interested in trends in referral activity, variation in waiting times across services, or changes in clinical outcomes over time, the data is there to be explored. All analytical code to reproduce the results presented in this blog post is available on the nhstt R package website. We recommend checking the NHS England data quality notes before using this data, as they describe known issues affecting specific reporting periods or measures.

    If you use the package for a new analysis or have ideas for how it could be extended, we would love to hear about it. For questions or to report an issue, please open an issue on GitHub or get in touch with Milan Wiedemann.

    References

    Clark, David M. 2018. “Realising the Mass Public Benefit of Evidence-Based Psychological Therapies: The IAPT Program.” Annual Review of Clinical Psychology, ahead of print, January 19. https://doi.org/10.1146/annurev-clinpsy-050817-084833.

    Clark, David M, Lauren Canvin, John Green, Richard Layard, Stephen Pilling, and Magdalena Janecka. 2018. “Transparency about the Outcomes of Mental Health Services (IAPT Approach): An Analysis of Public Data.” The Lancet 391 (10121): 679–86. https://doi.org/10.1016/S0140-6736(17)32133-5.

    National Collaborating Centre for Mental Health. 2024. NHS Talking Therapies for Anxiety and Depression Manualhttps://www.england.nhs.uk/publication/the-improving-access-to-psychological-therapies-manual/.

  • Introducing our series on publicly available mental health data – NHS Talking Therapies for anxiety and depression

    This post opens a new series summarising publicly available mental health data resources, beginning with NHS Talking Therapies for anxiety and depression (NHS TT). The series aims to help researchers, analysts, and clinicians navigate existing data sources, understand their structure and limitations, and use them effectively to inform and conduct research projects.

    The NHS Talking Therapies programme

    In 2008, England began the roll out of the Improving Access to Psychological Therapies (IAPT) programme which established psychological therapy services that would deliver evidence-based treatments for common mental health disorders (CMHDs), such as anxiety disorders and depression. The services, recently renamed NHS Talking Therapies for anxiety and depression (NHS TT), operate in all areas of England and are based on a public promise that patients will:

    1. Receive the relevant NICE recommended psychological therapies for their presenting problem
    2. Have treatment delivered by clinicians who are specially trained in those therapies
    3. Have the outcomes of everyone who receives treatment recorded with aggregate reports made available to the public

    From a small beginning in the first year the NHS Talking Therapies services have grown to a point where over 670,000 patients receive a course of treatment each year. National reporting shows that services are currently collecting pre-post outcome measures for 98% of patients receiving treatment, which is achieved in part through the use of session-by-session routine outcome measurement throughout therapy to track treatment progress. The national dataset, which now comprises around 8 million treated patients, also includes detailed information on patient demographics, some physical health information, types and dose of treatment, wait times, employment, and more. Importantly each service collects the same standardised minimum dataset (MDS).

    OpenSAFELY Talking Therapies: A step change for psychotherapy research

    The individual-level patient records within this national dataset represent an extraordinary resource for research, particularly when linked with other NHS datasets such as primary care data to answer questions about treatment effectiveness, long-term outcomes, and the broader impacts of psychological therapies on both mental and physical health. As part of the Wellcome funded OpenSAFELY Talking Therapies project, we will integrate individual level NHS TT data into OpenSAFELY, enabling privacy-preserving linkage across multiple datasets while providing secure access for researchers. This integration will transform how researchers can work with NHS TT data. Automatic and reliable data linkage in near real-time will turbo-charge psychological therapy research and make it possible to answer questions that have been difficult or impossible to address until now.


    Here are some examples: We will be able to rapidly evaluate new digital therapeutics and treatments by comparing outcomes at population scale with appropriate control groups. The linkage of full EHR records for all NHS TT patients (approximately 8 million treated patients and growing) will also enable much more comprehensive research on “what works for whom?”, with access to detailed medical information before, during, and after accessing Talking Therapies, including physical health conditions and complete medication history. Building on the success of our OpenSAFELY Co-Pilot programme, we will launch a programme to provide intensive ongoing support for mental health researchers with deep domain knowledge around psychological therapies but minimal experience with research using electronic health records.

    Beyond the individual-level linked data that will be available as part of the OpenSAFELY Talking Therapies project, NHS England already publishes detailed aggregated NHS Talking Therapies data that is freely and openly available to everyone.

    Publicly available NHS TT data

    NHS England already publishes extensive NHS Talking Therapies data freely and openly, accessible to researchers, analysts, clinicians, and the public. These aggregated publications are published at three different reporting frequencies (yearly, quarterly, and monthly), allowing anyone to analyse patterns in one of the largest psychological therapy programmes globally.

    Each publication serves distinct purposes and offers different levels of detail. Alongside the raw data files, each publication is accompanied with an interactive dashboard summarising some, but not all, of the publicly available data. All measures are described in detail in the NHS Talking Therapies Metadata file (available for download here). Table 1 gives an overview and brief comparison of the different data publications and dashboards.

    Description of raw dataContent in dashboards
    MonthlyTimely, high-level statistics used by NHS England to monitor key performance indicators including access, waiting times, and outcomes such as “recovery”. Some patients may appear in more than one reporting period. The raw data is well structured, with unique identifiers, separated into 3 groups (205 core measures, 110 employment advisor measures, 12 long-term condition measures as of September 2025).The monthly dashboard presents referral activity, waiting times, treatment completions, and outcomes, with visualisations of changes in these measures over the previous 12 months.
    QuarterlyAggregated data covering a three-month period, providing a more stable view of activity and outcomes than the monthly data. Not all monthly measures are included in the quarterly reports. Quarterly reports are broken down in more detail (e.g., ethnic groups, religion) compared to monthly reports, similar to the breakdowns in the annual data.The quarterly dashboard the selected measures, including demographic, clinical and regional breakdowns, with the ability to compare providers, regions, and Integrated Care Boards (ICBs).
    AnnualThe annual reports consist of processed and validated episode-level data from the monthly reports, covering a full NHS financial year. They include detailed analyses by service, clinical condition, and demographic as well as regional breakdowns. The data structure is different from the monthly and quarterly datasets.Two main annual dashboards are available: (1) the Annual Interactive Dashboard and (2) the Therapy-Based Outcomes Dashboard, each providing measures for one annual period.
    Table 1. Overview of publicly available NHS TT datasets (monthly, quarterly, annually) and dashboards.

    Annual publications provide the most comprehensive and reliable view of NHS TT activity and outcomes. These reports are extensively validated and cleaned to remove duplicates and ensure data accuracy. Each release includes complete activity data from referral through discharge, with detailed analyses of outcomes and service delivery.

    Quarterly and monthly publications support operational monitoring and management. They include statistics on the number of referrals, waiting times against six- and eighteen-week standards, treatment starts and completions, recovery rates, and employment support activity. These publications benefit from the ability to understand immediate service usage metrics, but have not been processed and validated to the extent of the annual reports.

    Data access and format

    All publicly available data can be accessed through NHS Digital’s website as Excel and CSV files. While comprehensive, these data files come in multiple separate tables that require some data management before they can be interpreted carefully.

    However, researchers should be aware that not all fields in the public datasets are equally reliable or suitable for research purposes. For example, the patient experience questionnaire data, while potentially valuable, has very low completion rates (around 10% compared to 98% for clinical outcomes), limiting its usefulness for research. Similarly, some fields like appointment duration may contain default values rather than actual recorded times, requiring careful validation before use.

    Variable names have also changed over time as the programme has evolved, adding another layer of complexity for researchers attempting longitudinal analyses. We are working on making the data more accessible to interested parties in a structured way, including developing tools that give researchers easy data access to the publicly available NHS TT reports.

    What comes next 

    This series will explore publicly available mental health data in more detail. Future posts will include explanations of NHS TT outcome metrics, as well as guidance on working with NHS TT data. We will also write about other national mental health data resources including the Mental Health of Children and Young People surveys, the Adult Psychiatric Morbidity Surveys, and the Mental Health Services Data Set (MHSDS).

  • Introducing OpenSAFELY Talking Therapies

    OpenSAFELY Talking Therapies will make it easier to carry out high-quality research on psychological treatments. We will securely add the NHS Talking Therapies (NHS TT) dataset to the OpenSAFELY platform, creating a new national resource for studying how psychological therapies perform in routine NHS care.

    We will also launch an Electronic Health Record Support Unit (ehrSU) to help researchers use these data safely and effectively. The ehrSU will support mental health researchers with deep domain expertise but limited experience working with electronic health records.

    This project will open up the full potential of the NHS TT dataset while maintaining strong privacy protections. It will support studies that improve understanding of what works for whom, and why, in line with Wellcome’s mental health strategy for driving a step change in early interventions for anxiety, depression and psychosis.

    Once established, we plan to expand this framework to also support research across other areas of mental health data sources, such as Child and Adolescent and Community Mental Health services.